
User guide
1. Getting started
- Get the exe from the download page. There is nothing to install — put it in any folder and double-click it.
- If Windows shows a “Windows protected your PC” box the first time, see how to open it.
- The free edition shows a short ad when it starts. Registering a paid key removes ads (Paid key).
- The program needs an internet connection while you use it. Your log and data files are never sent anywhere (Privacy Policy).
If you have no files yet, start with Try with sample data on the start screen. It opens the same screen as the pictures in this guide.
2. Opening files
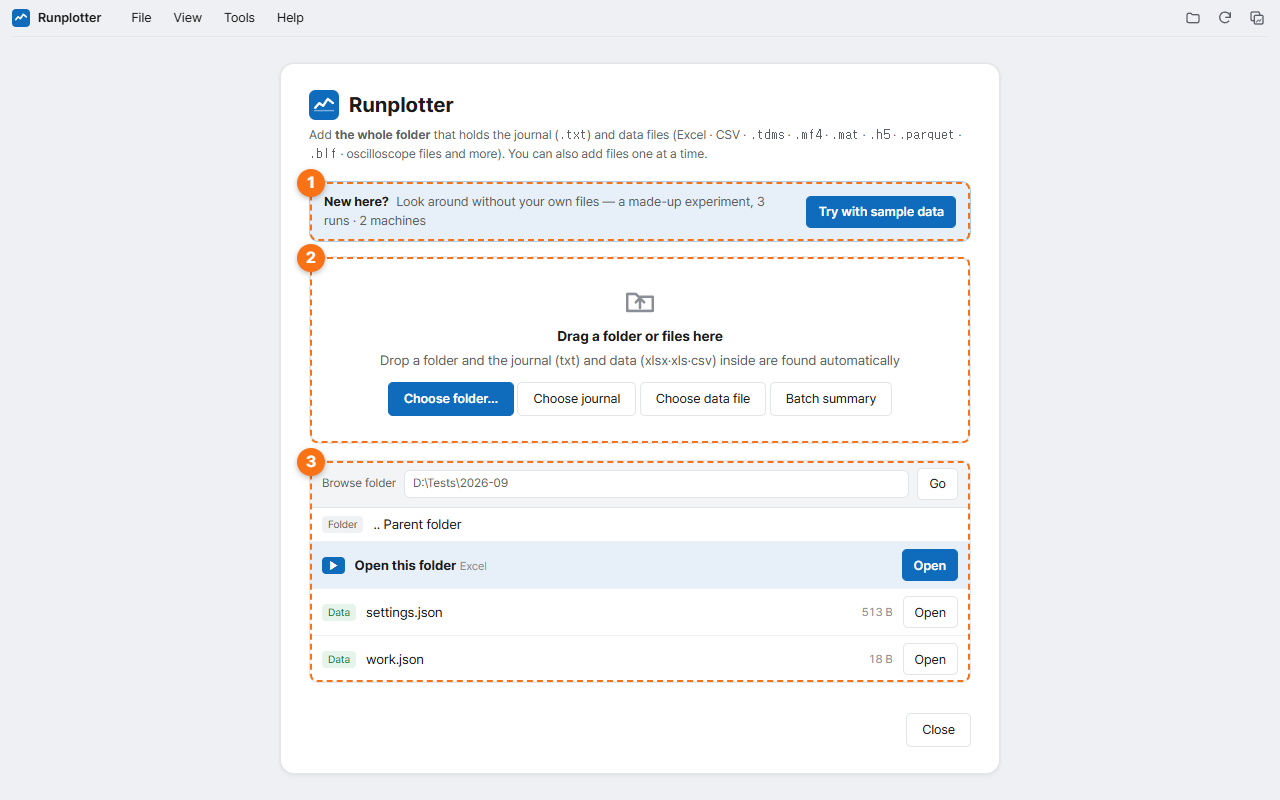
- Try with sample data — look around without any files.
- Drag and drop — drop a whole folder containing the experiment journal (
.txt) and data files (see the list) and the program finds them. Single files work too. The buttons below let you choose a folder, journal or data file separately. - Browse folder — type a path or click through the list to pick files.
- The journal is a text file saying when each experiment ran; the data is the timestamped values the machines recorded. Without a journal you still get charts from the data alone (only the split into runs is missing).
- If you add data while something is already open, you choose Replace (close the current data and show only the new) or Add to current (view them together). To view files from several machines together, choose “Add to current”.
- If the log grows during an experiment, press F5 (or the reload button at the top right) to read it again. The view stays where it was.
- To open something else, use File → Open… in the menu (Ctrl+O).
Files it can read
The format is detected from the file's content, not its extension. Time columns, delimiters and encodings are detected too.
| Tables · spreadsheets | .xlsx .xlsm .xlsb .xls .ods .csv .tsv .dat .asc .prn .txt .json .jsonl |
|---|---|
| Measurement · lab | NI .tdms .tdm .lvm · ASAM MDF .mf4 .mdf · HBM catman .bin · DEWESoft .dxd .d7d .dxz (synchronous channels only) · MATLAB .mat · .h5 .hdf5 · .parquet |
| CAN bus logs | Vector .blf .asc · PEAK .trc · Linux candump .log · MDF bus logs — open a .dbc or .ldf too to decode signals |
| Oscilloscopes | Tektronix .wfm .isf · LeCroy .trc · Rigol .wfm (DS1000E · Z · DS2000 · DS4000 · DHO) · Rigol · Keysight · Agilent .bin · Siglent .bin · R&S .bin (+ .Wfm.bin) · each maker's CSV |
| Compressed | .zip .gz .bz2 .zst — opens the data file inside (the largest one if a zip holds several) |
- NI
.tdmneeds its.tdxvalue file next to it. - DEWESoft asynchronous and 24-bit channels and Yokogawa
.wdfcannot be read. Export them to CSV from the program that made them.
3. A tour of the screen
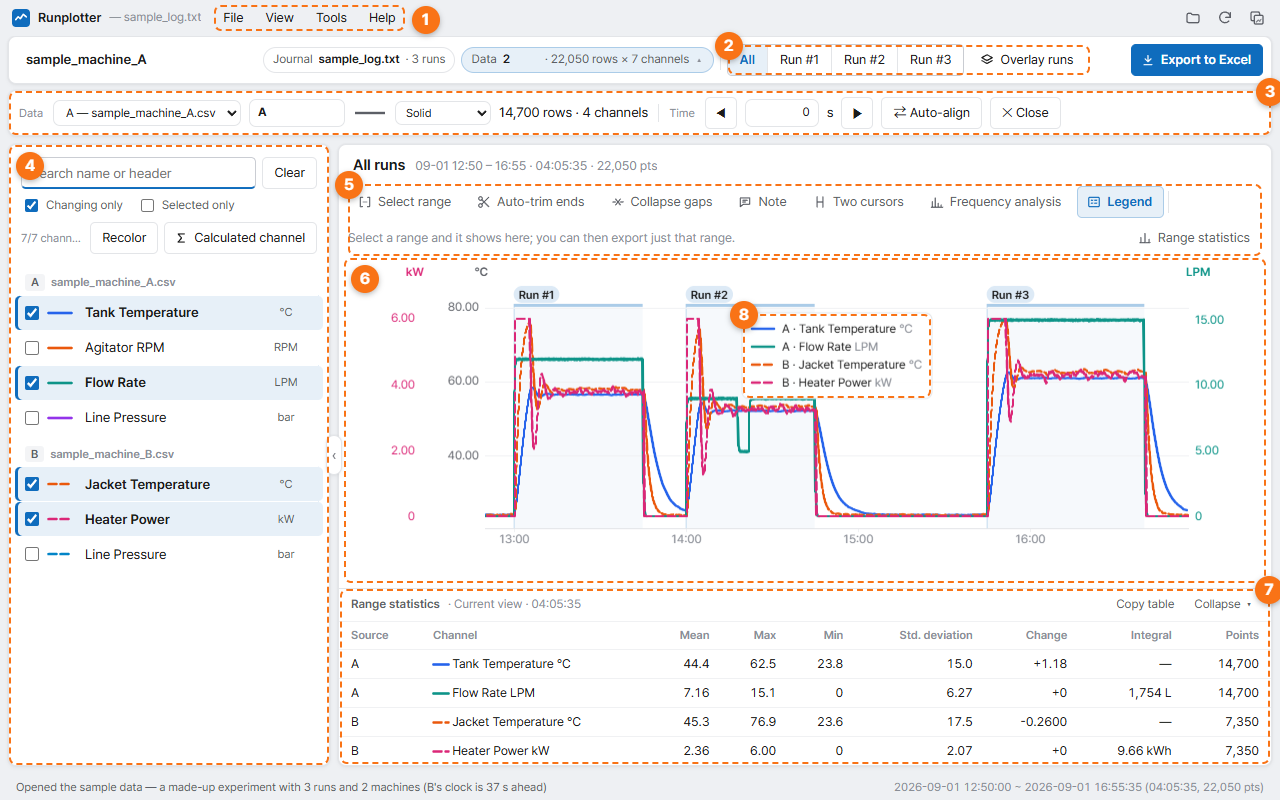
- Menu — File (a full-window file screen: Open · Batch summary · Export to Excel · Save image · Copy image · Options · License · About), View (theme · language), Tools (run detection settings), Help (chart controls · license · updates · about). The three small buttons at the far right are Open · Reload · Copy image.
- Runs — view All or a single run. Overlay runs is covered in section 7.
- Data bar — with two or more data files, set each file's name, line style and time correction (section 6).
- Channel list — the values in your files (temperature, flow …). Tick a channel to draw it. Use the search box to find a name, and click a name or unit to edit it. With Changing only on, columns that never change are hidden. Recolor repaints the ticked channels so their colours are easy to tell apart.
- Chart tools — Select range · Auto-trim ends · Collapse gaps · Note · Legend · Range statistics (section 5).
- Chart — channels with the same unit share a vertical axis. Hover to see the values at that moment.
- Range statistics — mean · max · min · standard deviation · change · integral of the ticked channels over the current view (or the selected range). Copy table pastes straight into Excel.
- Legend — a box floating on the chart. Drag it anywhere; double-click it to send it back to a spot with few lines. It is included in Save image · Copy image.
The box at the top left holds the experiment name. It is used for the Excel file name.
4. Runs
The program finds the “run starts” and “run ends” lines in the journal and splits the data into runs. Most journals work as they are; if runs are missing or wrong, fix it in Tools → Run detection settings….
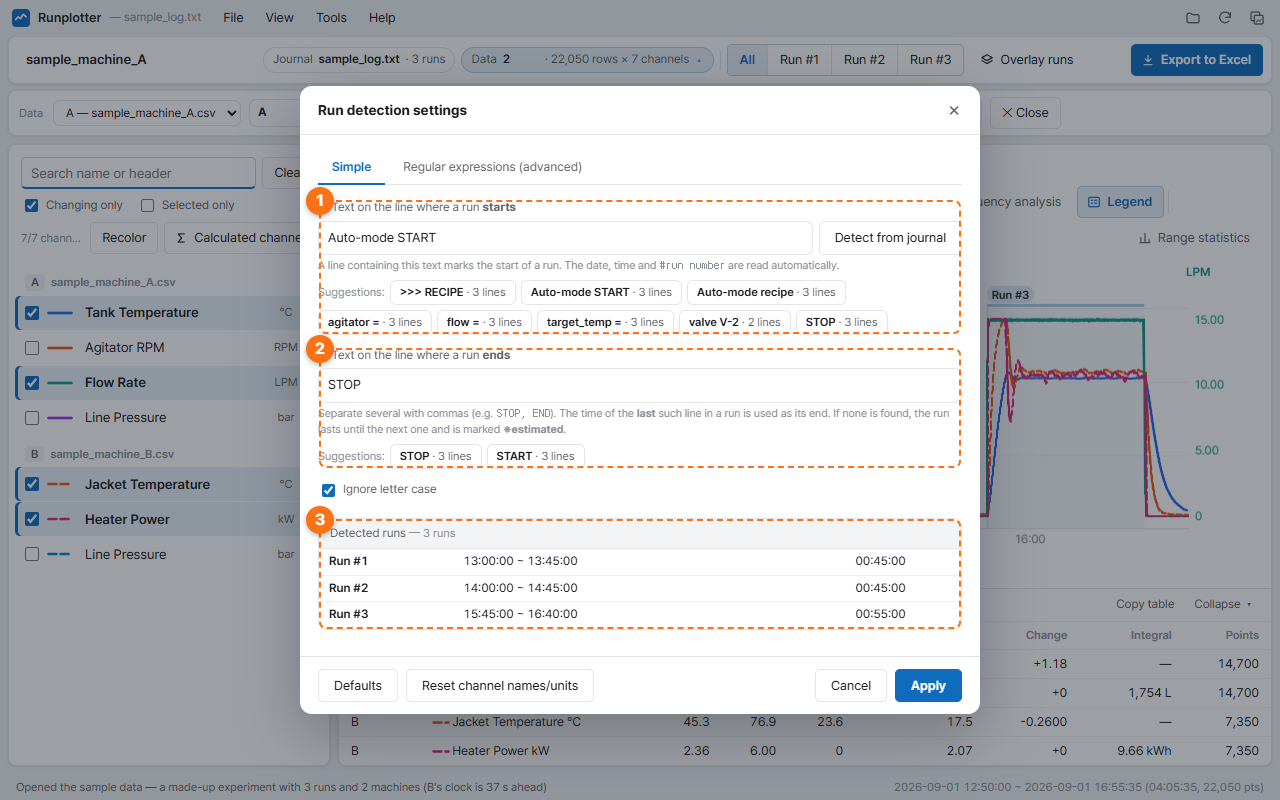
- Text on the line where a run starts — lines containing this text mark the start of a run. Detect from journal suggests text that appears often in your journal; click a suggestion to use it.
- Text on the line where a run ends — you can list several, separated by commas (e.g.
STOP, END). If no end line is found, the run lasts until just before the next one and is marked ※estimated. - Detected runs — updates as you type. If it looks right, click Apply.
- For journals that plain text cannot describe, use the Regular expressions (advanced) tab.
- Rename a run in the run box at the top (leave it empty to go back to “Run #N”). ◀ ▶ step to the previous or next run.
- Settings are saved on this PC and reused the next time you open a journal of the same kind.
5. Working with the chart
| Wheel | Zoom in · out |
|---|---|
| Drag | Pan left/right |
| Shift + drag | Select a range |
| Double-click | Reset zoom |
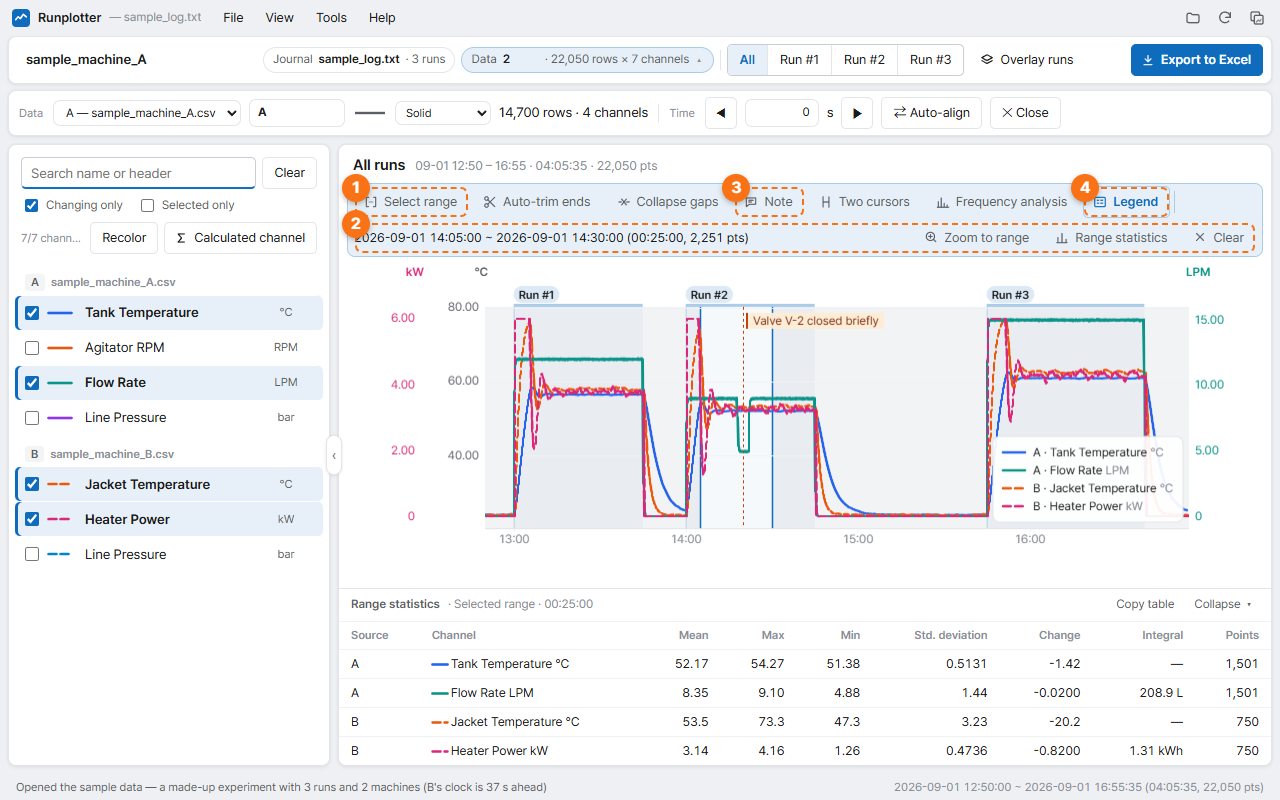
- Select range — click it, then drag across the chart to select a range (the same as Shift+drag).
- The selected range is shown here. Zoom to range zooms in, Range statistics shows statistics for it, and Clear removes it. With a range selected, Export to Excel can export just that range.
- Note — click it, then click a spot on the chart to attach a note at that moment. It shows as a vertical line and goes into saved images and Excel.
- Legend — show or hide the legend box on the chart. When hidden, the legend moves to a line above the chart so it covers nothing (saved images then have no legend).
- Auto-trim ends — finds the flat parts before and after the experiment and leaves them out.
- Collapse gaps — removes the idle time between runs and joins them up.
- Two cursors — click it, then click the chart twice to see the values at two times, the time difference (Δt · 1/Δt), the value difference and the slope. Further clicks move the nearer cursor.
- Frequency analysis — shows the spectrum and the largest peaks of the selected channels over the visible range (or the marked range). Switch to a log axis or dB.
- Save image · Copy image (File menu, Ctrl+Shift+C) — save the chart as you see it to an image file or copy it to the clipboard, ready to paste into a report or chat.
6. Overlaying several machines
Open data files from several machines together and they are drawn on one chart. Machine clocks often differ by a little, so there are tools to line up the times.
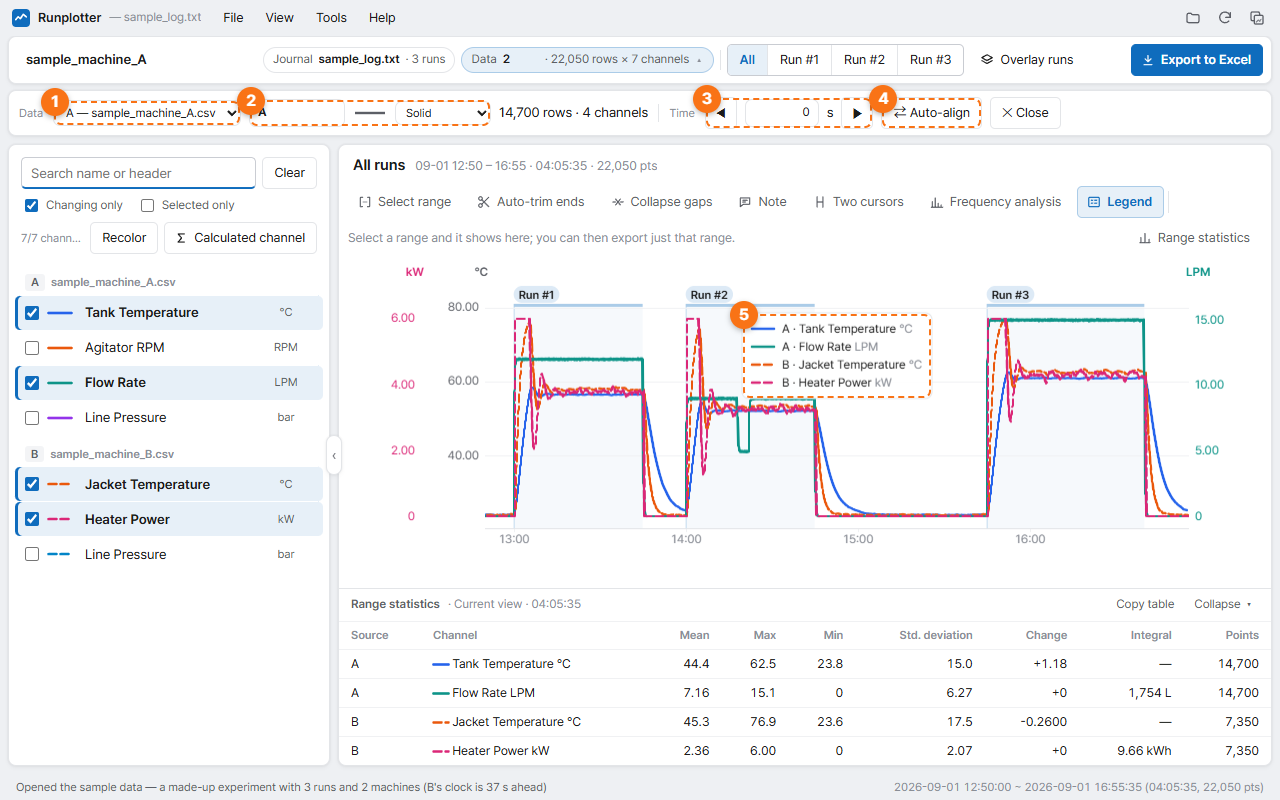
- Choose data — the file this bar works on.
- Name · line style — a short name for the file (e.g. Line A) and its line style on the chart (solid, dashed …). The same channel from different machines is told apart by line style.
- Shift time — move this file's timestamps earlier or later, in seconds. Type a value, or hold ◀ ▶ to keep moving (Shift 10 s · Alt 1 min · Ctrl 0.1 s at a time).
- Auto-align — compares how the values move against another file and finds the offset in seconds. It shows what it found and applies it when you confirm.
- Legend — the letter before a channel name (A · B) tells you which file it comes from.
Time corrections and names are saved and reused the next time you open the same files. To remove a file, click Close.
7. Overlaying and comparing runs
Use this to compare runs made under different conditions. The chosen runs are each shifted so they start at 0 and drawn on one chart. The horizontal axis becomes time since start instead of clock time.
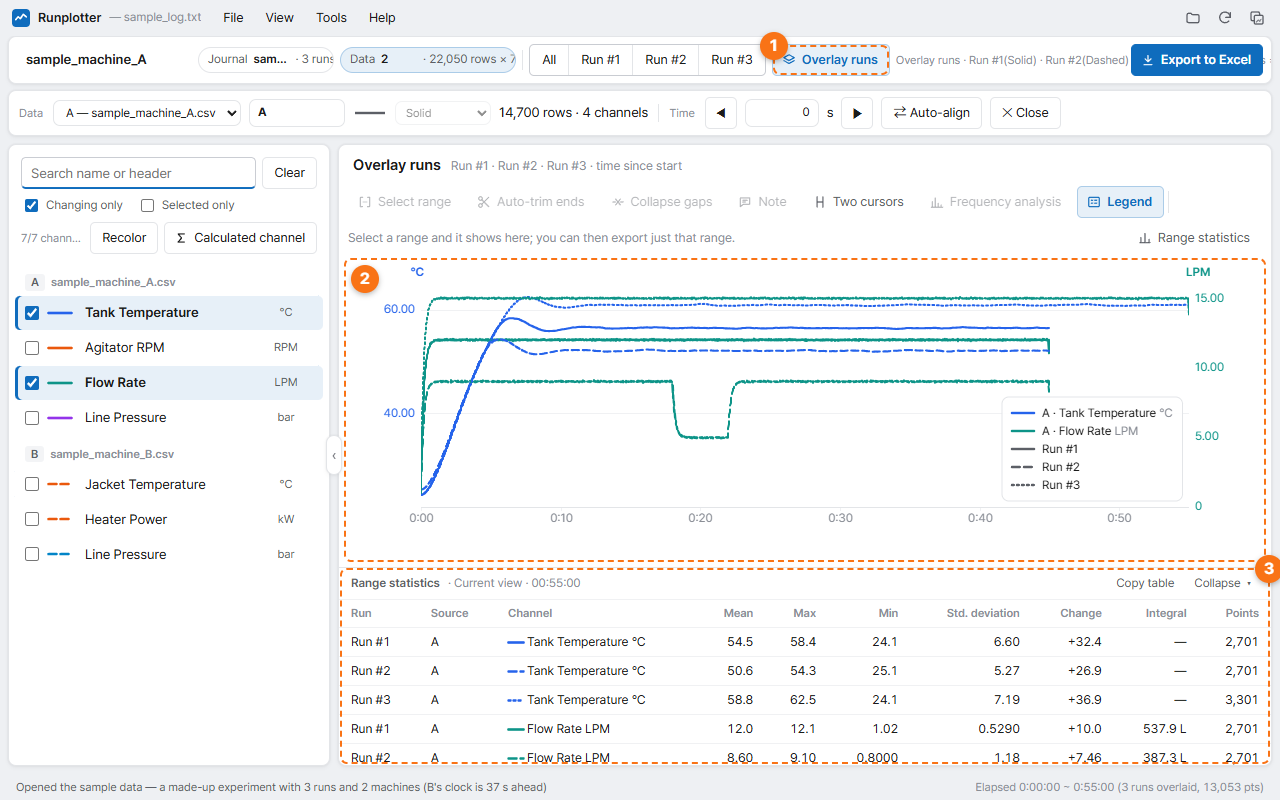
- Overlay runs — choose two or more runs and confirm. The same button turns it off.
- Colour means channel; line style means run (Run #1 solid · #2 dashed …).
- Range statistics show one row per run, so you can compare means, maxima and changes run by run.
While runs are overlaid, Collapse gaps and range selection are off.
8. Calculated channels
Make a new channel from existing ones (e.g. the temperature difference between two machines, or a moving average of a noisy signal). Open it with the Calculated channel button above the channel list.
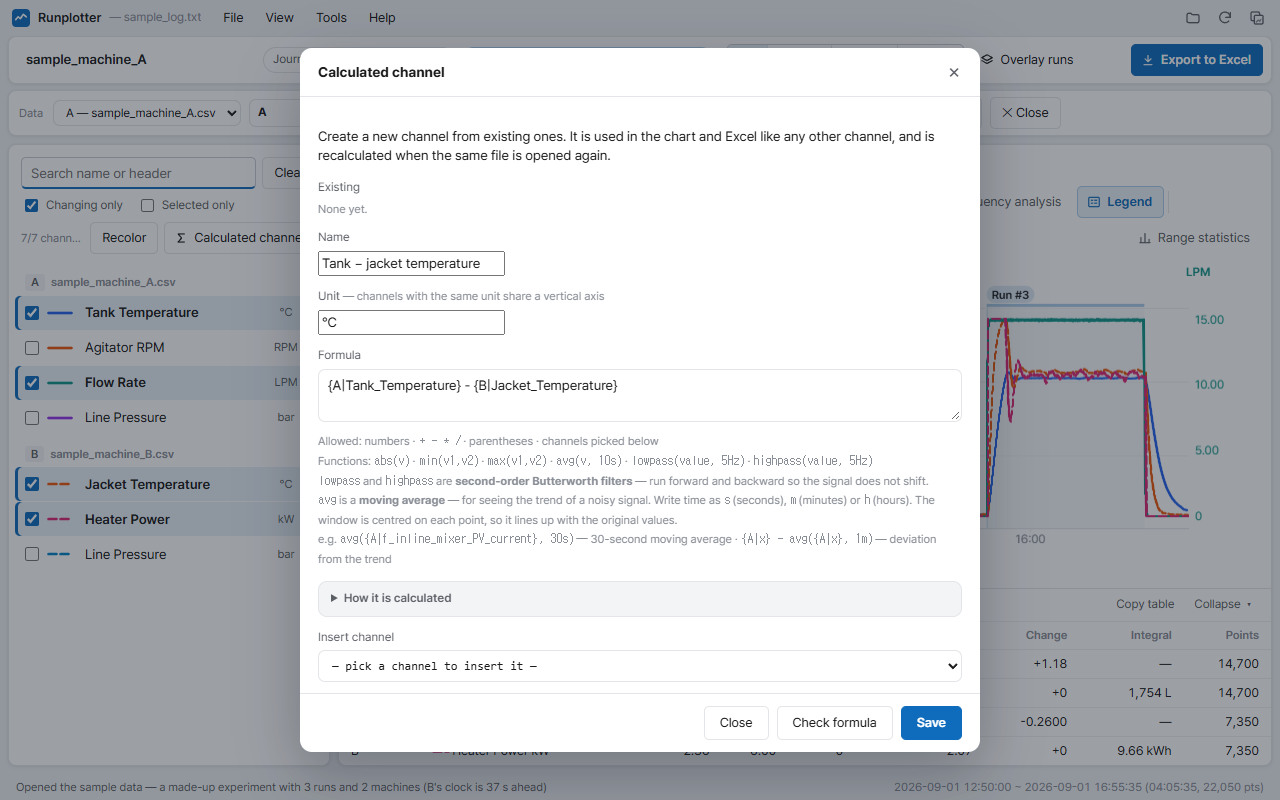
- Enter a name · unit, and pick channels under Insert channel to add them to the formula.
- Formulas can use numbers ·
+ - * /· brackets and the functionsabs·min·max·avg(moving average) ·lowpass·highpass(filters). E.g.lowpass(channel, 5Hz)— a 5 Hz low-pass filter (run forward and backward, so the signal does not shift). E.g.avg(channel, 30s)— a 30-second moving average. Write times ass(seconds),m(minutes),h(hours). - Click Check formula, then Save. The new channel works like any other in the list, the chart and Excel, and is recalculated the next time you open the same files.
- How empty values, division by zero and timestamps from different files are handled is under How it is calculated in the window.
9. Exporting to Excel
Export to Excel at the top right (Ctrl+E) puts the channels you are viewing into one Excel file.
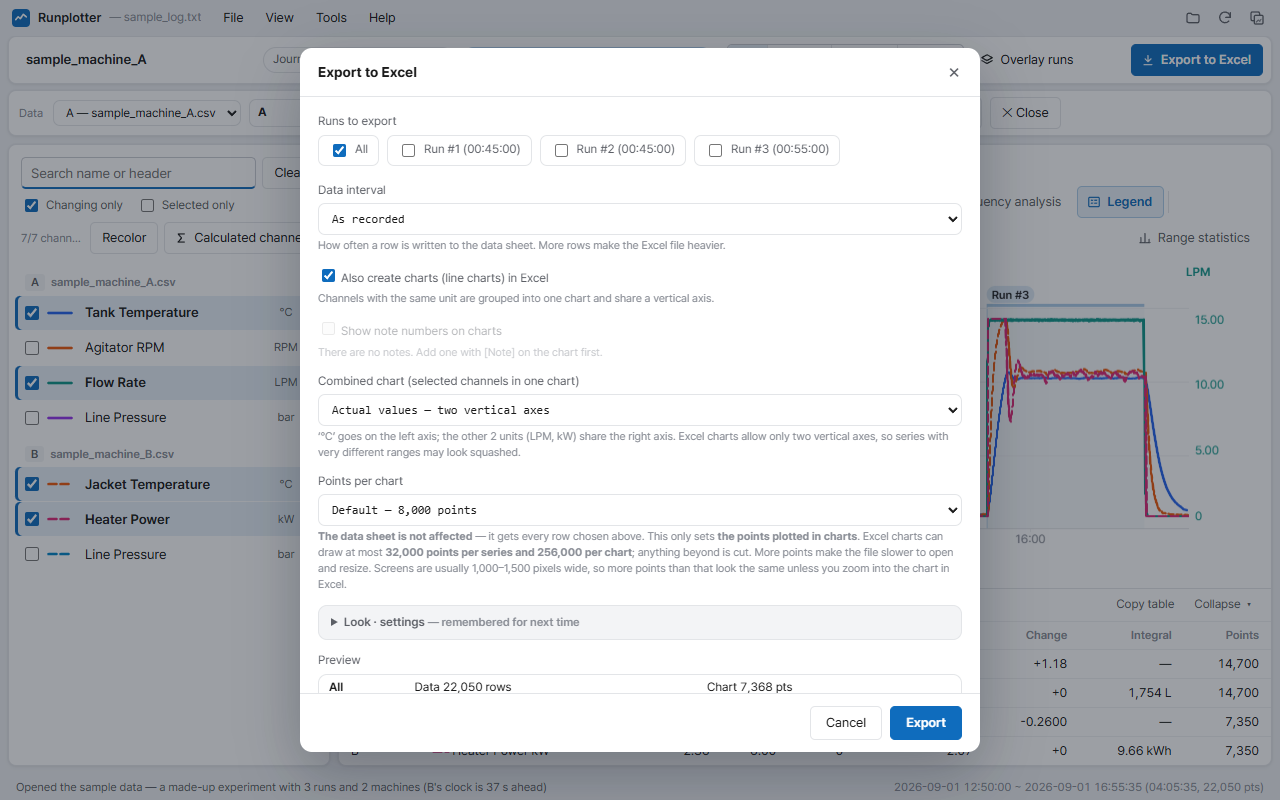
- Runs to export — all or individual runs (you can tick several). If a range is selected, Selected range is ticked for you.
- Data interval — as recorded, or one row every 1 s · 5 s · 1 min … More rows make a heavier file.
- Also create charts in Excel — channels with the same unit share one chart. If there are notes, their numbers are marked on the charts.
- Combined chart — the chosen channels in one chart, either as actual values or scaled 0–100% (for comparing shapes).
- Points per chart — affects the charts only. The data sheet always gets every row at the chosen interval.
- Look · settings (expand) — theme (default · clean · print black & white · company colour), font · size, decimal places, time on data sheets (date-time or elapsed), sheets to include, chart legend position · size, file name rule. Your choices are reused next time.
The file contains an Experiment info sheet (runs · times · experiment conditions · notes), a Range statistics sheet (mean · max · min · std. deviation · change · integral per channel and run — the same values as on screen), data sheets (Excel tables with filter buttons) and charts. Notes appear on the charts with their number and text. Printouts fit an A4 page width with page numbers. Channel names, units and colours are exported as you set them on screen.
10. Batch summary
When there are many files — say, a month of logs — this opens each data file in a folder, calculates mean · max · min · standard deviation · change · integral for the chosen channels and writes one Excel sheet. Open it from File → Batch summary or Batch summary on the start screen. The data open on screen is not touched.
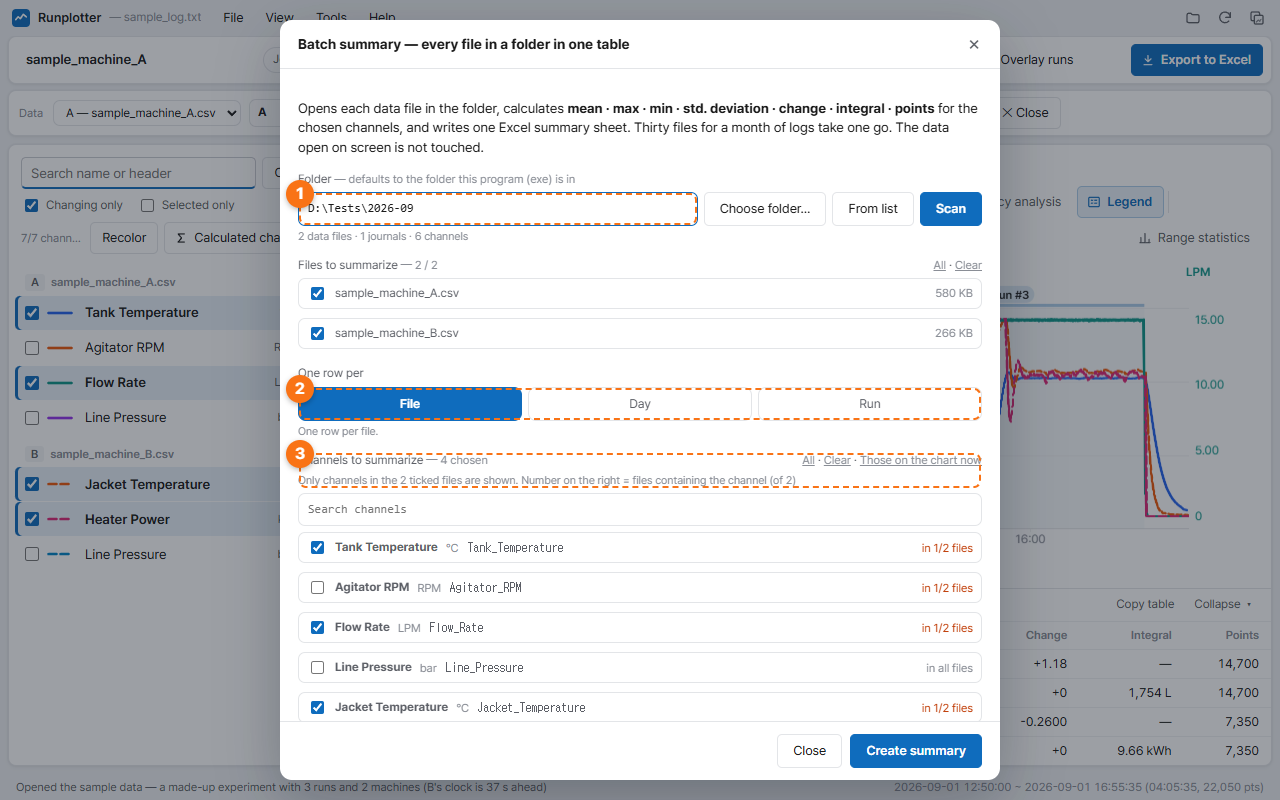
- Choose a folder and click Scan to list its data files and channels (subfolders are not included). Pick the files to summarize.
- One row per — file · day · run.
- Channels to summarize — channels found in the ticked files. The note on the right says how many files contain each one. Those on the chart now picks the channels ticked on screen.
When you are done, click Create summary.
11. Options
Click File in the menu and the whole window turns into the file screen; choose Options there. The arrow button takes you back.
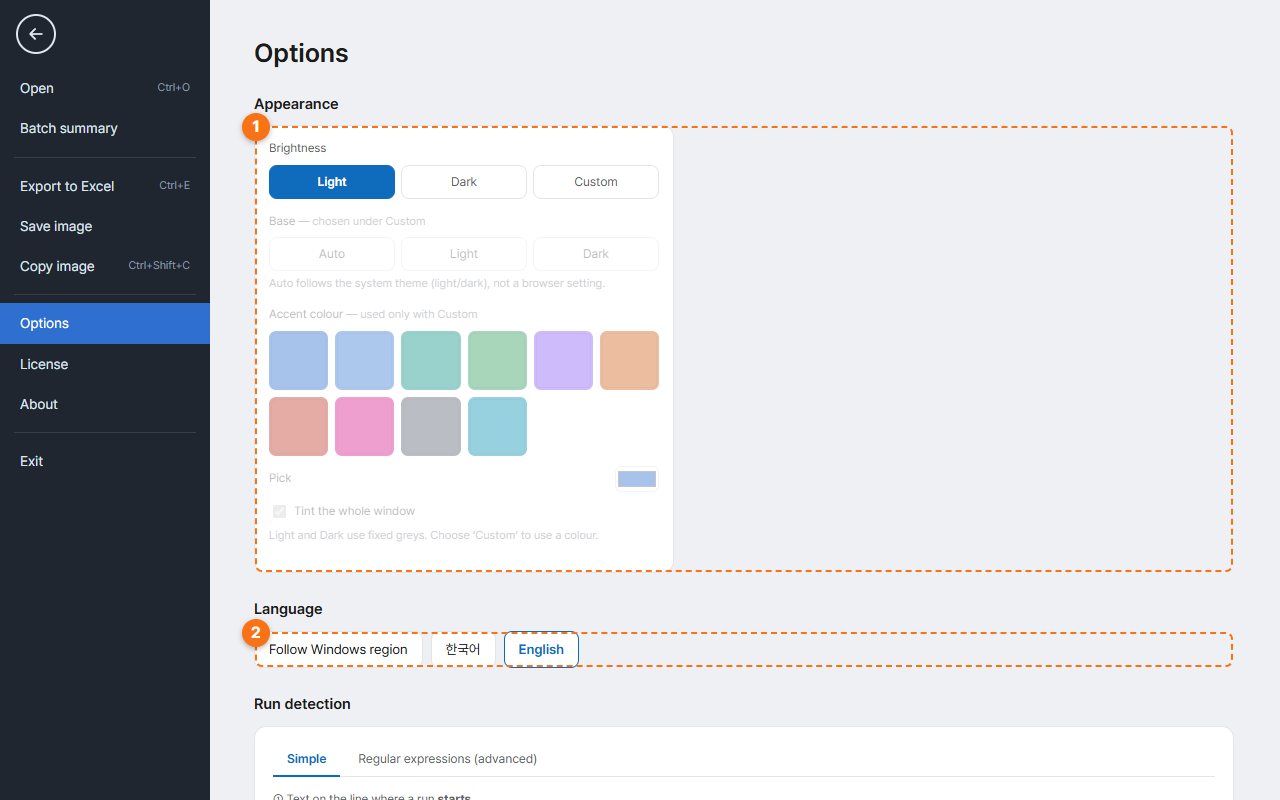
- Appearance — Light · Dark · Custom. Custom lets you pick the base (including following the system) and an accent colour.
- Language — Follow Windows region · 한국어 · English.
Run detection further down is the same as the settings window in section 4.
12. Paid key
Work use at a company or organization needs a paid key (Plans). With a key registered, no ads are shown.
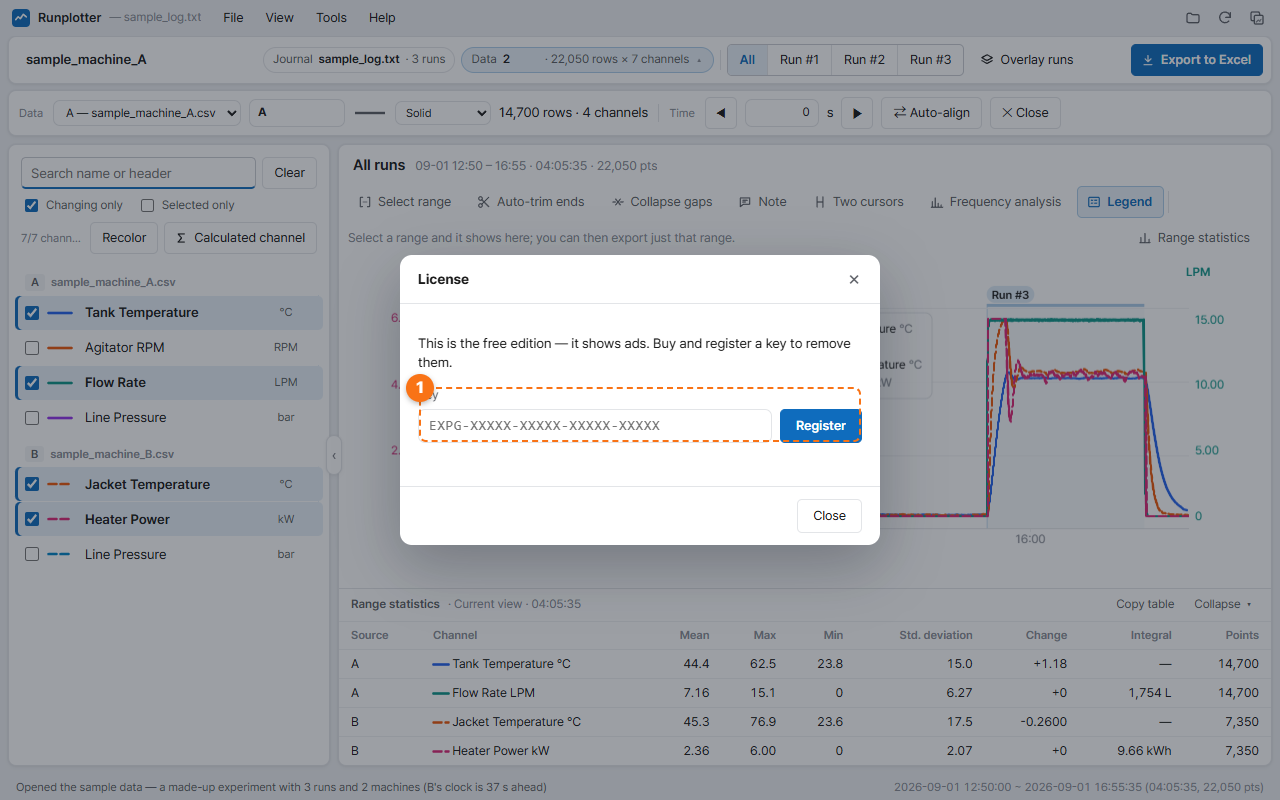
- In Help → License…, enter your key and click Register.
- One key lets one person register up to 2 PCs.
- Changing PCs: click Release from this PC in the same window, then register on the new PC. If the old PC cannot be started (broken · wiped · returned), you can move its seat from the same window on the new PC.
- For cancelling a subscription or refunds, see the Refund Policy and how to buy · how to cancel.
13. When something goes wrong
| If | Then |
|---|---|
| Runs are missing or wrong | Change the start · end text in Tools → Run detection settings…. Detect from journal suggests candidates. |
| A channel is not in the list | Turn off Changing only to show columns that never change. The search box also finds the original column header. |
| Machines look out of step | Their clocks differ. Use Auto-align or Shift time. |
| The Excel file is too heavy | Raise the Data interval in the export window to 1 s, 5 s etc., or select a range and export only that. |
| “Lost connection to the server” appears | Check your internet connection; the message goes away once it reconnects. If a company firewall is the cause, pass the IT review page to your IT team. |
| “Windows protected your PC” on first start | See how to open it. |
| Is there a new version? | Help → Check for updates… or the release notes. |
If that does not help, e-mail us as described on Support —
14. FAQ
Installation, privacy, firewalls and how many PCs you can use are covered in the FAQ on the home page. These are the questions that come up while using the program.
Files · settings
Where are my names, notes and time corrections saved?
In the folder where the program (exe) is.
settings.json— display, language, run detection settings, export look, keywork.json— channel names · units · colours, calculated channels, run names, notes, machine names · time corrections
If that folder can't be written to (a read-only location, for example), they go to your user folder (%APPDATA%\expgraph) instead. Your log and data files are never changed.
I want to take my setup to another PC or give it to a colleague
Copy the whole program folder (the exe plus work.json · settings.json) and your names, units and calculated channels go with it. When giving it to a colleague, leave out settings.json — it holds your paid key.
How do I start over from scratch?
Close the program, delete work.json (work history) and settings.json (settings) next to the exe, and start it again. Your paid key also has a copy in your user folder, so you don't need to enter it again.
My notes are gone
Notes are attached to the journal file name (or the first data file name if there is no journal). If you renamed the file or opened a copy with another name, open it under the original name. The folder doesn't matter.
How many data files can I view together?
Up to 6 on one screen. Each file gets its own line style, and beyond that they become hard to tell apart. Remove files you don't need with Close on the data row. To compare values across many files, use Batch summary.
Can I watch a log that keeps growing during an experiment?
Yes. Press F5 (reload) to read what was added; the view stays where it was.
Charts · Excel
The legend covers the lines
Drag the legend box to an empty spot. Double-click it to send it back to a spot with few lines. To hide it, turn off the Legend button in the chart tools (section 5).
Can I edit the charts in the Excel file?
Yes. They are real Excel charts, not pictures, so you can change axes, colours and titles in Excel. For a picture that looks exactly like the screen, use Save image · Copy image.
The Excel file is too big or slow
Raise the Data interval in the export window to 1 s or 5 s, or select a range and export only that. You can also leave out the data sheets (Look · settings → sheets to include) and export only the statistics and charts.
Reports get printed in black and white
Choose print black & white under Look · settings → theme in the export window. Lines are then told apart by style (solid · dashed), so they still read in black and white.
Paid key · payment
How do I get my key after paying?
When the card payment finishes, the key appears on screen right away, and we also send it to the e-mail address you paid with. Enter it in Help → License…. For company purchases by quote, we e-mail the key once the payment arrives.
I lost my key
On a PC where it is already registered, the Help → License… window shows the key (partly hidden), and that PC keeps working. If you need the full key, write to with the e-mail address you paid with.
Do I have to enter the key again after a new version?
No. If you overwrite the exe in the same folder nothing changes, and if you put it in another folder the key follows from the copy in your user folder. Your work history (names, notes) lives in the program folder, though — if you used another folder, move the old work.json into the new one.
Do ads come back as soon as I cancel?
No. You keep using it until the end of the period you paid for, then it goes back to the free edition (with ads). Your names and notes stay (how to cancel).